Pipelines
[Pipeline photos]
Within the pipeline industry it is well known that corrosion is a major contributing factor to pipeline failures. Pipelines carry products, including dry gas, wet gas, crude oil with entrained/emulsified water, and processed liquids.
Pipeline incidents in the U.S. and in Europe have been reported on in three major publications:
1995-2014
Pipeline and Hazardous Materials Safety Administration Pipeline (PHMSA) – Pipeline Incident Data.
1970-2013
European Gas pipeline Incident data Group (EGIG) – Transmission Pipeline Incident Data.
2004-2013
Transportation Safety Board (TSB) of Canada – Pipeline Incident Data.
The radar diagram in Figure 5-5 shows the response of selected pipeline operators in the U.S., Canada, and India. The intent of creating this diagram was to observe differences in corrosion management for pipeline companies that operate under different regulatory environments. The diagram shows the scores of three groups of pipeline operators from India (three operators), Canada (four operators), and the U.S. (two operators). While the U.S. and Canadian pipeline companies operate under strict national regulations (set by PHMSA and the National Energy Board (NEB), respectively), where the majority of corrosion control activities are driven by regulations, the Indian pipeline company follows company standards and regulations, which are largely based on internal/local standards and recommended practices.
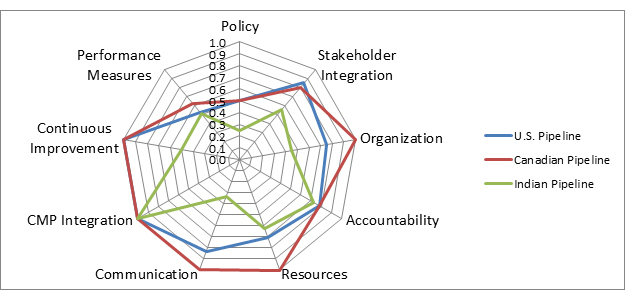
Figure 5-5. Benchmarking of U.S., Canadian, and Indian onshore pipeline companies.
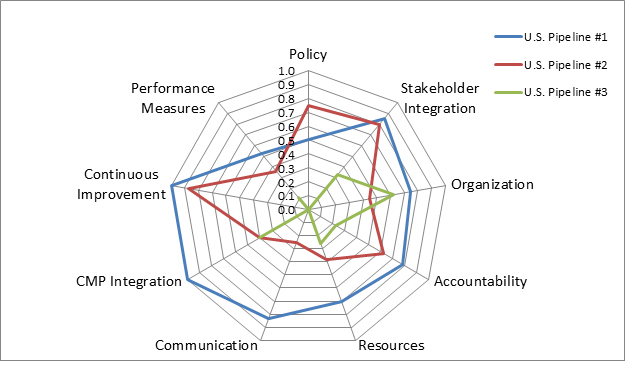
Figure 5-6. Benchmarking of three U.S. onshore pipeline companies.
Despite these different regulatory environments, all three pipeline groups show similar scores for the elements of performance measures, CMP integration, and accountability. All three pipeline companies show a low score for policy and performance measures, which might indicate an opportunity for improvement by better engaging senior management. Moreover, the relatively low score for performance measures indicates that there is an inadequate feedback system or related key performance indicators (KPIs) that measure the status and quality of corrosion management. In general, the Canadian and U.S. pipeline companies exhibit similar trends and the Indian pipeline company is generally lower in scoring on many areas except as noted above.
When the survey responses are examined at the more detailed level of individual U.S. pipeline companies (see Figure 5-6), significant differences between the companies become apparent. While Company #1 shows an overall better-than-average scoring, Company #3 scores poorly in most categories.
There is a significant varied approach to corrosion management within the U.S. pipeline companies responding to this survey. Some U.S. companies meet but do not exceed regulatory requirements; they often want to exceed the minimum but do not find an economic or other incentive with respect to corrosion management. With a fully integrated CMS, decisions on the ROI, cost benefit, or reduction in risk (whichever measure is used by an organization) would be better understood by all stakeholders, including senior management. These decisions would result in a lower risk picture for the organization, and consequently lead to (i) increased financial performance, (ii) safer pipeline operation, and (iii) fewer environmental issues.
Figure 5-6 shows a significant gap between communications from one company to another. This is the result of some companies drawing lines between responsibilities, which can create silos. As shown in the diagram, one company that scored high on communication also scored high on continuous improvement and CMP integration. The company scoring high on these three elements also has a lessons learned program.
Figure 5-7 shows the radar diagrams for responses from four Canadian-based pipeline companies showing trends similar to the U.S. pipeline industry. Unlike U.S. companies, Canadian pipeline companies show similar scoring with average to best scoring in the lower left quarter of the diagram; i.e., continuous improvement, CMP integration, and communication. As with the global and U.S.-specific companies, the policy, performance measures, and stakeholder integration elements scored medium to low. In addition, the accountability, and resources scores are in the mid-range of performance.
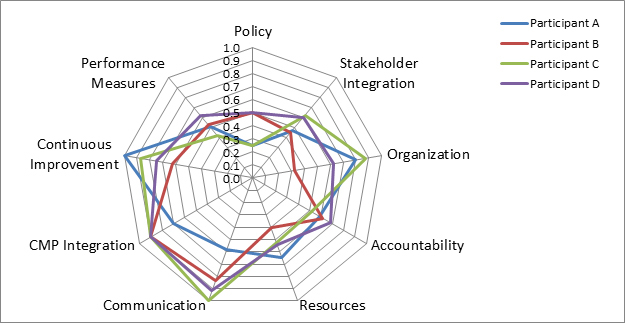
Figure 5-7. Benchmarking of Canadian-based onshore pipeline companies.
The relatively uniform response scores may be an indication that Canadian pipeline companies are all following the regulations that encourage continuous improvement, integration, and communication. However, as with the U.S. pipeline companies, the low scores for policy and performance measures indicate opportunity for improvement by better engagement of senior management.
As discussed in the Benchmarking Survey Results section, a key observation from the survey was a correlation between survey respondents who indicated that their corrosion management approach (i) could use improvement to better understand the total cost of corrosion and (ii) have strong continuous improvement practices (Figure 4-8). While the pipeline industry was among the top performers in continuous improvement practices, the recognition that more could be done shows that corrosion management in these industries is still developing. Moreover, in order to truly understand the costs, these industries understand that there is still opportunity for improvement.