General Observations
The response to one of the initial questions, whether a specific organization has a corrosion management strategy, is shown in Figure 4-4 (recall that the number of respondents is low for some geographies [Table 4-4]). The figure shows the responses according to geography. The graph shows that only a low percentage of the survey participants responded with having no strategy. The majority however, limit corrosion management to technical requirements only with the Middle East companies scoring 100%. The percentage of companies claiming to have a comprehensive corrosion management strategy is relatively low; only Asian, Australian and North American respondents indicated that they have a comprehensive corrosion management strategy. By far the majority of respondents indicated that their organization’s corrosion management program is limited to technical aspects only. This would indicate that most corrosion management programs are not integrated throughout an organization’s overall management system.
With 99 respondents, the petroleum/oil/gas industry had the most returns with the remaining industries ranging from four to 24. The ability to make statistically significant statements concerning corrosion management practices based on geographies and industries is limited by the number of responses received. Nevertheless, geography and industry practices were compared based on the available data. Because benchmarking is key for companies comparing practices among geographies, industries, and peers, the benchmarking capability from this study will continue. It will be possible for companies to perform a corrosion management self-assessment for the first time or perform a re-assessment of their practices through a continuing program sponsored by NACE International.
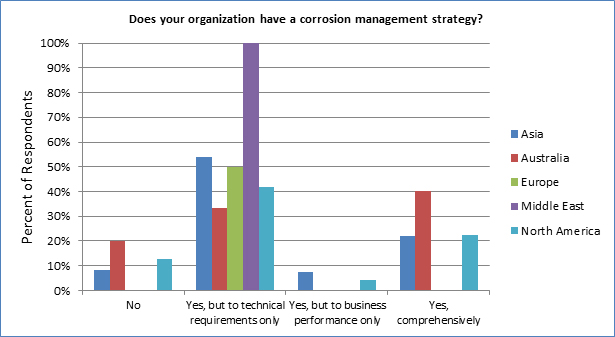
Figure 4-4. Corrosion management strategies.
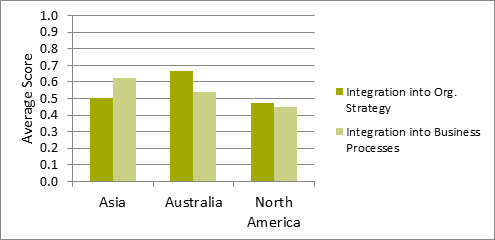
Figure 4.5. Corrosion management strategies and performance for three geographic regions.
For the three geographical regions shown in Figure 4-5, there is a link between (i) corrosion management strategy integrated into the organizational strategy and (ii) corrosion management performance integrated into organizational performance metrics (both relatively high for these regions). The link between integration of corrosion management strategies and corrosion management performance into the overall organization is obvious. This says that strategies and performance should be linked. Certainly this must be true for a robust CMS.
Figure 4-6 shows the average total scores by industry. The highest possible score was 76. The figure indicates that the industries with the highest scores were (i) petroleum/oil/gas, (ii) pipelines, (iii) airlines, logistics, transportation, and (iv) chemicals. These industries scored approximately 40 or just over 50% of the total possible score. Figure 4-7 shows the average total scores by geography. Asia and Australia had the highest average scores (40 and 38, respectively) of the five geographies examined. In reviewing these data it must be recalled that certain industries and geographical regions had limited participation and the scores may not represent entire industries or regions (Table 4-4). Europe and the Middle East had only two respondents to the survey.

Figure 4-6. Total survey scores by industry.
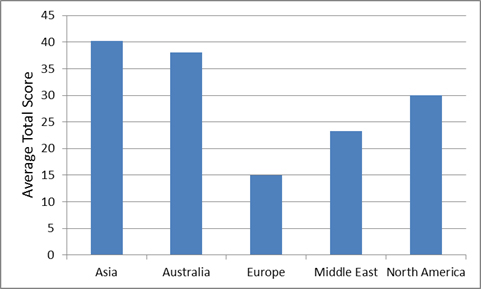
Figure 4.7. Total survey scores by geography.
The petroleum/oil/gas and pipeline industries scored the highest in continuous improvement but stated that their CMS could use improvement to better understand the cost of corrosion (Figure 4-8). Continuous improvement activities ensure that an organization recognizes that there is an ability to improve. While petroleum/oil/gas and pipeline industries were top performers in continuous improvement practices, the recognition that more could be done shows that corrosion management in these industries is still developing. Moreover, in order to truly understand the costs, these industries understand that there is a necessity for improvement.
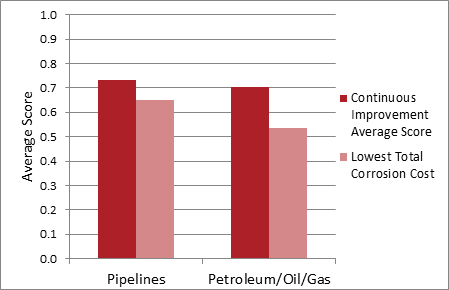
Figure 4-8. Continuous improvement and need to have better understanding to achieve lowest total corrosion cost for pipeline and petroleum/oil/gas industries.
Figure 4-9 shows the average scoring by geography. It should be noted that Asia, Australia, and North America show similar scores and trends, while the Middle East and Europe responses generally deviate from this pattern (recall that there are only two respondents for each of these geographies). All geographies show low scoring for performance measures. This would indicate that regardless of whether a CMS is in place, there is little measure of the effectiveness of the program.
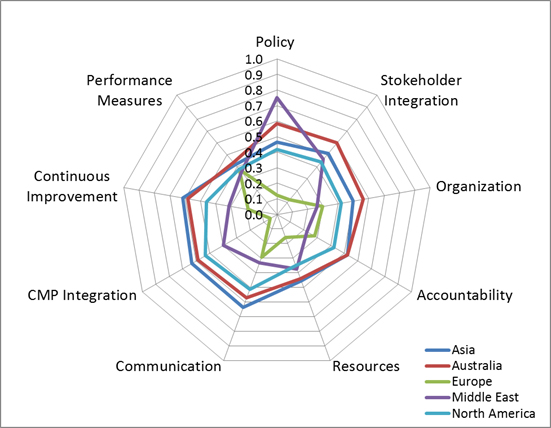
Figure 4-9. Radar plot showing average scoring by geography.