Building the Survey
Corrosion Management Practice Model
Table 4-1. CMPM Domains
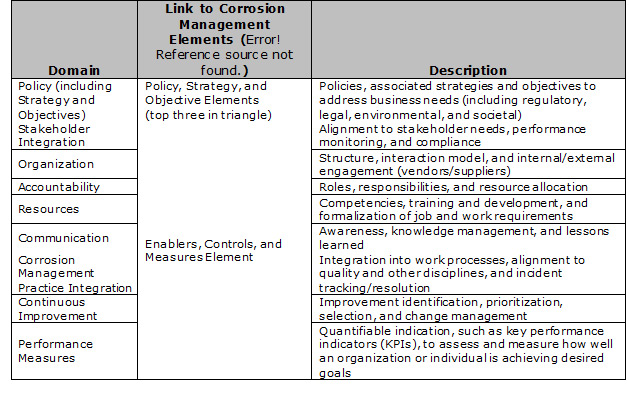
The Corrosion Management Practice Model (CMPM) was developed to provide a repeatable framework for assessing the structure, approach, and features that comprise a CMS within an organization. Corrosion management practices were identified across nine management system domains (see Table 4-1) and aligned to Figure 3.3. The survey was developed to examine corrosion management practices in each of these domains over the life cycle of assets to be managed – design, manufacturing/construction, operations/maintenance, and abandonment.
Seventy questions were asked across the CMPM domains and asset life cycle phases; see Appendix C.
Using the structure of the CMPM, each corrosion management system practice was converted into a single assessment question with a range of pre-set answer options. The answer options typically ranged from (i) no, the organization does not perform that practice or have the capability, (ii) to successively higher levels of capability or proficiency (see example in Table 4-2).
The resulting assessment survey was then piloted with a number of organizations to ensure understanding and ease of completion. A web-based survey tool was then set up to allow direct entry by participating organizations via a provided URL.
Table 4-2. Example Survey Question and Answer Set
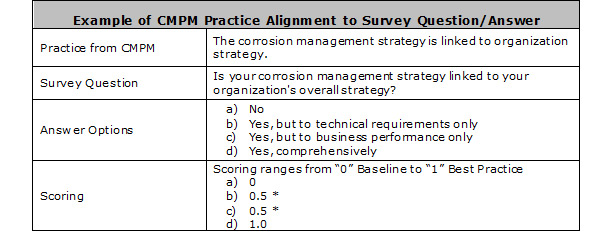 * Weighting of intermediate answers can vary depending on the question and options.
Engagement of Participants
The study project team engaged with global partners to help generate awareness of the CMPM self-assessment survey and promote participation (see Table 4-3). Each of the global partners agreed in advance to identify candidate organizations and support completion of the self-assessment survey.
Table 4-3. Listing of Global Partner Organizations

To support confidentiality, each global partner was assigned a set of participant codes they could distribute so that each participating organization could remain anonymous if desired as part of their self-assessment survey response. As self-assessment survey participant responses were received, the global partners assisted in the resolution of incomplete submissions or validation issues identified by the study team.
The self-assessment survey (Appendix C) was made available to participants over a three-month period to allow as many potential organizations possible to contribute. At the end of that period the survey was disabled to allow validation of the entire data set and subsequent analysis of the results.
Validation of Submissions
All submitted self-assessment surveys were processed through a professional data validation process. This included both logical and statistical validation steps to identify any anomalies. Each validation issue was then communicated back to the global partner if a participant code was used, or directed to the submitter for clarification. Any data with validation issues that did not reach resolution were omitted from the final data set.
Validation occurred in three stages:
1. Upon submission of a survey.
2. Once a large pool of surveys had been submitted.
3. When the survey collection period ended.
When a survey was submitted, initial validation of the survey by itself was performed. This considered completeness and the logical patterns of answers across related questions. Resolution of any issues was then worked immediately. Once a large pool of survey submissions was in place, an initial view of statistical validation was conducted to identify anomalies across the participants. Again, identified issues were worked immediately. When the survey was closed and collection completed, the full data set then went through additional statistical analysis and issues were resolved as described above.
A total of 721 self-assessment surveys were started by participants, but only 267 passed the full validation process. Many of those that did not pass validation did not include key data necessary for reasonable inclusion into the data set. After numerous unsuccessful attempts to reconcile the validation issues, those submissions had to be excluded. While those submissions were not included, the study team did compare analysis results with and without those submissions and saw no appreciable change in the results. This gives greater confidence that the results reported in the remainder of this report are relevant and accurate.
Demographics of Participating Organizations
Of the 267 validated CMPM self-assessment submissions, 243 contained information to permit the distribution across industry and geography (see Table 4-4).
Table 4-4. Distribution of Respondents According to Industry and Geography*
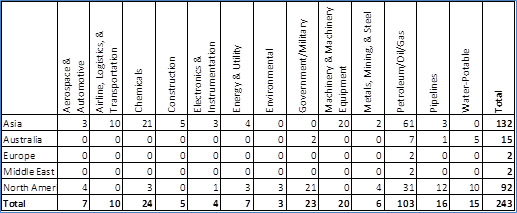 Note: * The respondents in several industry classifications and geographies were too low to develop statistically significant trends.
Analysis of Collected Self-Assessments
The study team performed a series of analyses on the self-assessment survey results including frequency analysis, capability score analysis, cross-tabulation analysis, and correlation analysis. From these a set of observations was generated that is discussed in the remainder of this report.
For each type of analysis performed, a comparison across geographical regions and industries was performed to identify differences.
It is important to consider the quality or validity of self-assessment data. In both self-assessments and facilitated assessments, organizations often take more credit for capabilities the first time they take an assessment. This may be because they do not want to reveal their limitations or lack of in-depth internal evaluation of their capabilities and processes. Hence, it may be assumed that the scores generated in the current study are generally higher than the actual current state. Despite these limitations, the trends shown in the overall observations and findings are valid and useful to the corrosion management and engineering community. In addition, the low number of participants in certain industries and geographies limit the ability to develop statistically significant trends.
Frequency Analysis
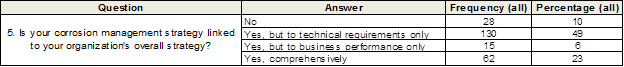
Frequency analysis looked at the distribution of answers for each question in the survey. From this it provided a snapshot of the global capability and also regional and industry comparisons. In the example provided in Table 4-5, approximately 90% of organizations link their corrosion management strategy to their organization’s strategy, but only 23% do this comprehensively for both technical and business requirements.
Table 4-5. Example of Frequency Analysis
Capability Score Analysis
Each answer option in the survey was assigned a capability score to allow calculation of a comparison score by participating organization, region, and industry. The scores reflect the successively higher levels of capability or proficiency based on answers selected. From this a set of heat maps (Figure 4-2) and radar plots (Figure 4-3) were generated to depict areas where more advanced capabilities and proficiencies exist. Scores for each CMPM practice range from 0 to 1, with 0 reflecting no capability and 1 reflecting the highest level of capability based upon the provided answer options. Figure 4-2 (heat map) provides question number, general area of question, and score for all questions in each management system element for each lifecycle category. Color provided with the score is green (high score), yellow (medium score), and red (low score). The heat map has a significant amount of data, but is hard to read except at a high level (green is good and red is bad). Figure 4-3 (radar plot) in shows only the score for each management system element. These graphs have less data than the heat maps, but are easier to view, especially when comparing multiple data sets. The heat map in Figure 4-2 provides an aggregate score for each question for all respondents. It indicates that abandonment is the weakest of the life cycle phases, while managing and developing resources and good performance measures are the weakest corrosion management system domains. Strengths for the aggregate of all respondents include integration into business processes, continuous improvement, and communication. Except for the life cycle phases (not included as a breakdown), Figure 4-3 in Survey Results provides the same conclusions as discerned from Figure 4-2. In Figure 4-2 aggregate scores for each management system domain is given. In the remainder of the report, radar graphs are used to present data.
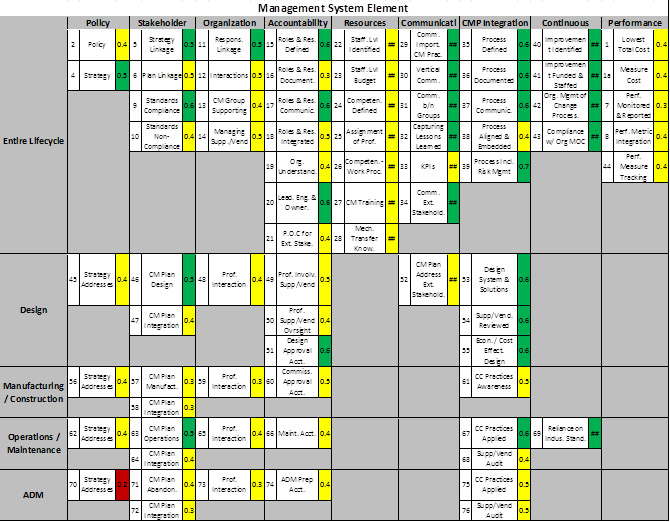
Figure 4.2 Example of capability heat map
(aggregate score for all participants).
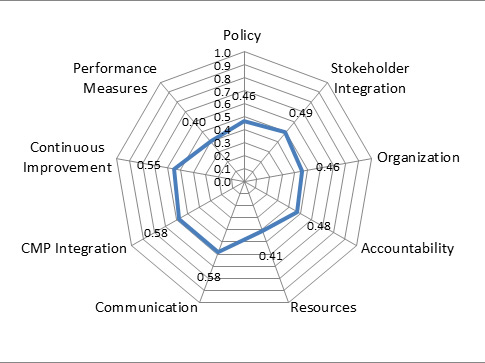
Figure 4.3 Example of radar plot or spider diagram
(aggregate Score for all participants).
Cross Tabulation and Correlation Analysis
Cross tabulation and correlation analysis took the trends and patterns from both the frequency and capability score analyses and looked for alignment. Insights gathered during the regional focus group discussions were also incorporated.
During these analyses the study team looked at different filtered views of the data set to gain additional insights. For instance, the top 10 scoring organizations were compared to all other organizations to identify any significant variances and evaluate why they exist.
A set of observations was developed and evaluated, resulting in key study findings.