Drinking Water and Sewer Industry
Much of the world’s drinking water infrastructure, with millions of miles of pipe, is nearing the end of its useful life. For example, nearly 170,000 public drinking water systems are located across the United States, and there are an estimated 240,000 water main breaks per year, most of which are caused by corrosion.
Failures in drinking water infrastructure result in water disruptions, impediments to emergency response, and damage to other types of infrastructure, such as roadways. Unscheduled repair work to address emergency pipe failures may cause additional disruptions to transportation and commerce. In cases where the water does not return to an aquifer, a valuable resource is lost. In addition, the availability of fresh water in the United States is a growing concern, especially on the West Coast where drought has significantly decreased water availability in many areas. This is only expected to grow as a major concern, making water loss from aging pipe infrastructure more critical. This has been a concern globally for a long time.
Despite these breaks, the quality of drinking water in the United States remains generally high. Although pipes and mains are often more than 100 years old and in need of replacement, disease attributable to drinking water is rare. Among other factors, this can be attributed to maintaining water pressure and the practice of boiling water after a pipe break. However, in countries such as India, uniform access to clean drinking water remains a challenge. Water line failure due to corrosion is a primary reason for water loss and the resulting threat of contamination. Many parts of India have drinking water unfit for consumption, which leads to jaundice and other waterborne diseases. Not maintaining positive water pressure in the pipelines and the failure to boil water after a pipe rupture are contributing factors.
Other pressures on a nation’s drinking water systems impact infrastructure costs. Financial impacts of meeting regulatory requirements are a continuing issue for many communities. In the case of drinking water systems, the most pressing rules are new, either recently issued or pending, as the result of standard setting by the U.S. Environmental Protection Agency (EPA) to implement the Safe Drinking Water Act Amendments of 1996. These rules impose new or stricter drinking water limits on numerous contaminants, including arsenic, radioactive contaminants, microbiological organisms, and disinfection byproducts. Funding has increased, so localities sometimes find the funds through reduced maintenance.
In 2012, the American Water Works Association (AWWA) concluded in a report that the aggregate replacement value for more than one million miles (1.6 million km) of pipes was approximately US$2.1 trillion if all pipes were to be replaced at once. Since not all pipes need to be replaced immediately, it is estimated that the most urgent investments could be spread over 25 years at a cost of approximately US$1 trillion.
Capital investment needs for the U.S. wastewater and storm water systems are estimated to total US$298 billion over the next 20 years. Pipes represent the largest capital need, comprising three quarters of total needs. Fixing and expanding the pipes will address sanitary sewer overflows, combined sewer overflows, and other pipe-related issues. In recent years, capital needs for the treatment plants comprised about 15 to 20% of total needs, but will likely increase due to new regulatory requirements. Storm water needs, while growing, are still small compared with sanitary pipes and treatment plants. Since 2007, the U.S. federal government has required cities to invest more than US$15 billion in new pipes, plants, and equipment to eliminate combined sewer overflows.
The Water Services Association of Australia (WSAA) provides an annual report that records and measures up to 117 indicators from 73 water utilities across Australia serving approximately 75% of its population. A number of these indicators were used and examined along with other information to determine costs associated with corrosion.
The costs were determined according to the following groupings:
- Water loss from pipeline failures.
- Intangible costs associated with water and sewer pipe failures and replacement.
- Water pipeline corrosion repairs.
- Sewer pipeline corrosion repairs.
- Sewage treatment costs due to infiltration.
- Capital cost for water and sewer pipeline replacements.
- Maintenance and repair water treatment plants.
- Maintenance and repair of other assets (tank, pump stations, etc.).
- Maintenance and repair of sewage treatment plants.
Based on the study, the total annual (2010) cost was estimated to be US$690 million + 30%. This translates to US$42 per person per year in Australia, compared to the cost per person per year in the U.S. of about US$85 determined in the 2002 U.S. FHWA cost of corrosion study.
Following the Australian study, recommendations were made (i) to raise the awareness in the water industry of the impact of corrosion on the infrastructure and the associated direct costs that result and (ii) to provide additional training in conjunction with key stakeholders.
When comparing corrosion management practices in North America and Australia, some significant differences in the responses from the water industry in the two different countries are evident. The radar plot in Figure 5-8 shows distinct differences in Continuous Improvement, CMP Integration, and Communication; where the Australian water companies scored significantly higher than the North American water industry. This is somewhat surprising considering the fact that the Australian water industry scored very low on policy, suggesting that on average the industry has limited corrosion management policy, which is considered critical to good corrosion management practices. The American water industry appears to have policies, but implementation can be improved.
Discussions with management and engineers of two U.S. municipal water companies are in agreement with the finding of the survey that the overall corrosion management is inadequate. Neither of the companies has a corrosion management policy, and discussions merely focused on near-term objectives such as the various corrosion control methods and limited budget to control corrosion.
One company in a region in the U.S. that currently suffers a drought quoted:
“The drought leads to a call for water conservation, leading to lower water sales, leading to smaller budgets.”
The radar plot in Figure 5-8 shows that both the U.S. and Australian water companies struggle with resources, which was confirmed by discussions with U.S. water companies. Engineers have a general responsibility for their organization’s infrastructure, of which corrosion control is a small part. There was a consensus that corrosion is limited as a career path, and often civil engineers with inadequate training and competency development in corrosion are charged with overseeing corrosion issues.
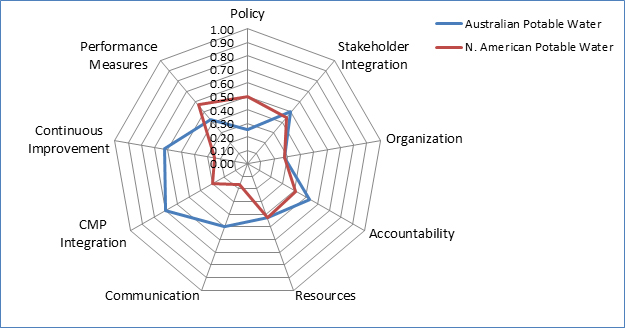
Figure 5-8. Radar Plot Comparing Corrosion Management Practices in Australia and North America